Introduction
This project focuses on predicting equipment failures and optimizing maintenance schedules using advanced machine learning techniques. The goal was to minimize downtime and costs while improving decision-making for industrial operations.
I analyzed customer payment behavior (Taiwan dataset) as an initial case study for classification modeling, then extended these insights to predictive maintenance, integrating both supervised learning and reinforcement learning approaches.
Dataset
The dataset provided a comprehensive view of customer profiles and behaviors, which I used as a foundation for building predictive models.
- ID: Unique client identifier.
- LIMIT_BAL: Credit limit in NT dollars.
- SEX, EDUCATION, MARRIAGE, AGE: Demographic features for segmentation.
- PAY_0 to PAY_6: Repayment statuses for the past six months, ranging from -2 (no consumption) to 9 (over nine months late).
- BILL_AMT1 to BILL_AMT6: Historical billing amounts.
- PAY_AMT1 to PAY_AMT6: Actual payments made each month.
- default.payment.next.month: Target variable indicating whether a default occurred.
These features formed a rich dataset that I later extended to predict equipment maintenance needs by drawing parallels between customer behavior and machine health patterns.
Visualization
The visual analysis revealed several important insights:
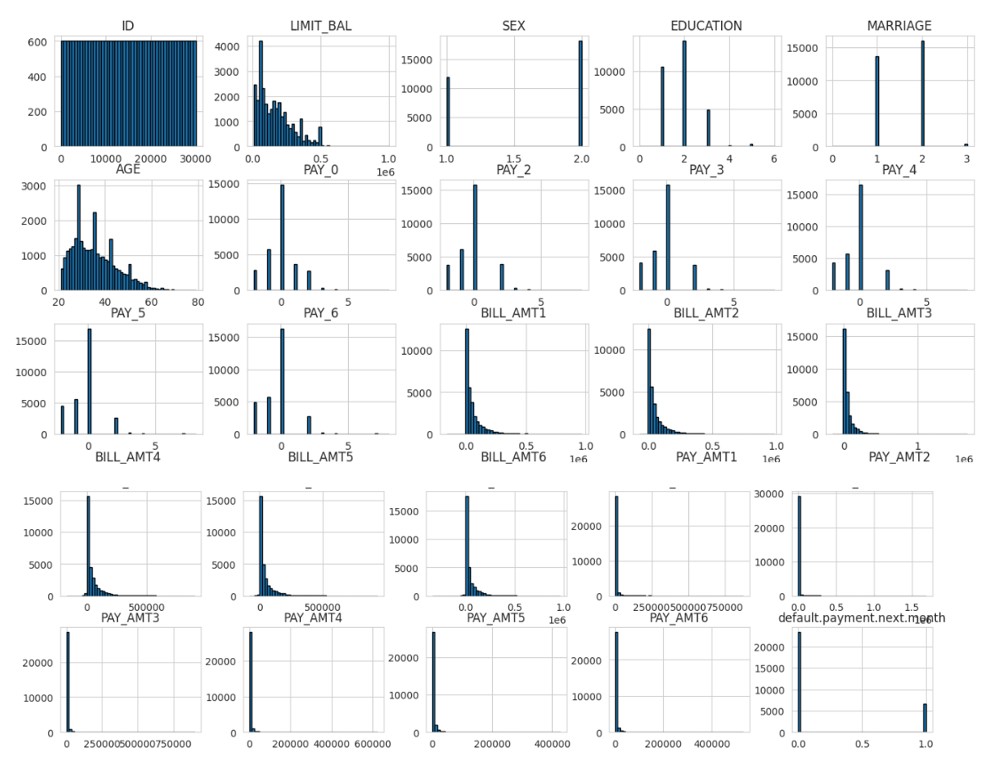
- Distribution of numerical features: Most features were right-skewed, with credit limits and payment amounts showing high variability.
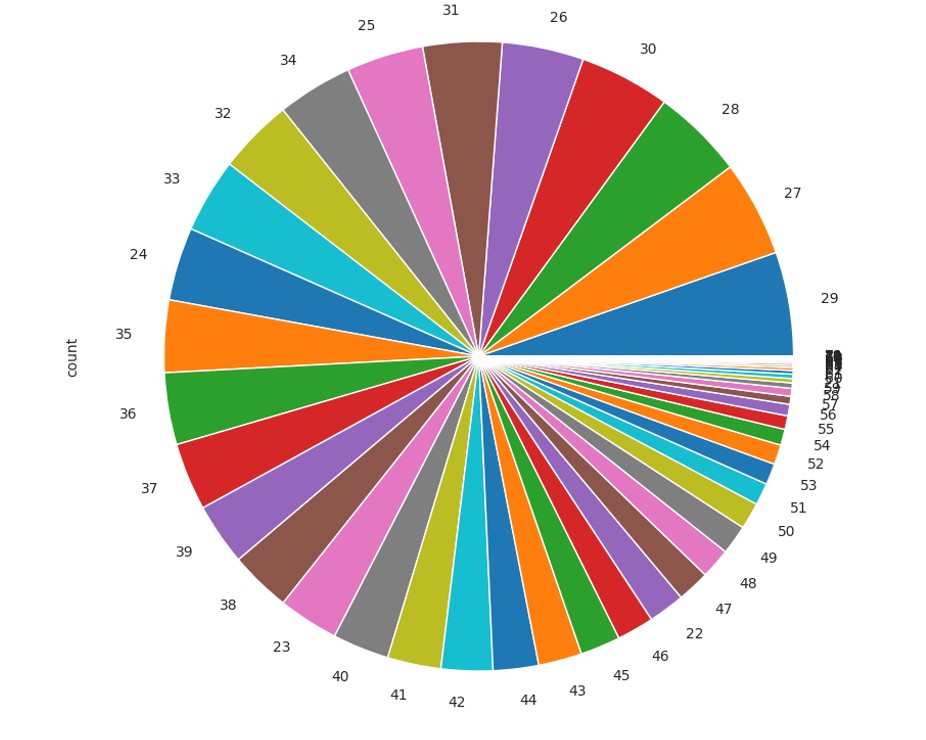
- Age and default correlation: Younger customers (21–30) displayed a higher default rate, while older groups (50+) showed significantly fewer defaults, suggesting a relationship between financial stability and repayment behavior.
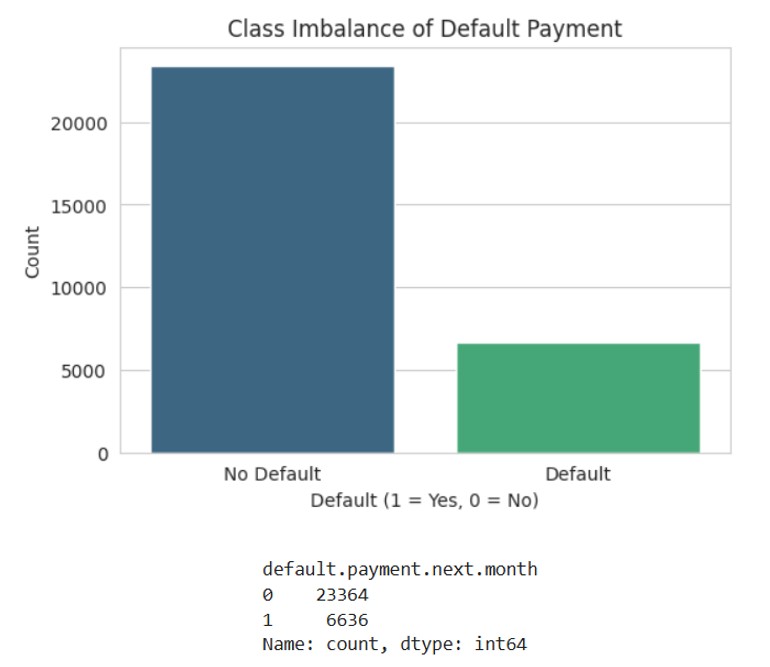
- Class imbalance: A strong imbalance was observed between non-default and default cases, requiring targeted techniques to improve model recall.
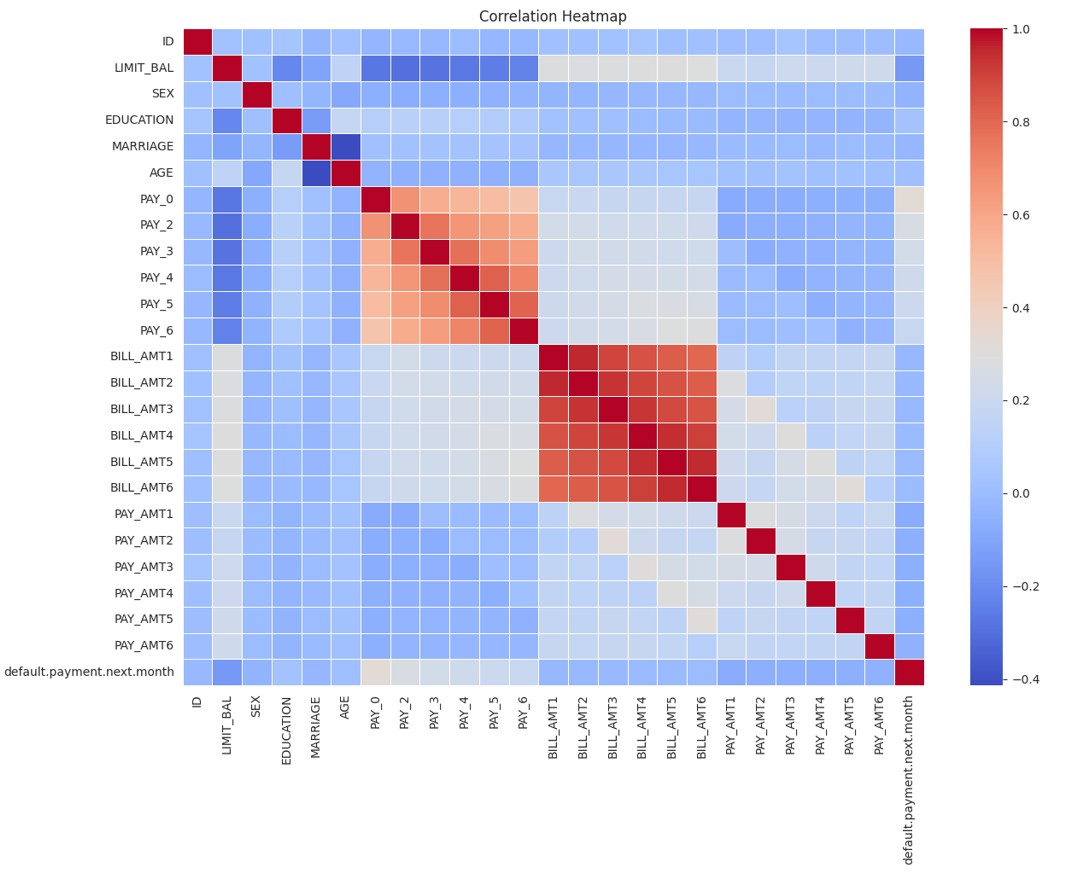
- Correlation heatmap: Strong correlations emerged between billing amounts and payments, while past repayment status variables (PAY_0, PAY_2) showed a significant impact on the likelihood of default.
Preprocessing
Data preprocessing was a critical step for building robust models:
- Feature grouping: Rare education and marital status categories were merged into “Others” to reduce noise and improve interpretability.
- Class imbalance handling: I applied SMOTE (Synthetic Minority Over-sampling Technique), which substantially improved the recall of minority (default) cases.
- Feature renaming and scaling: This improved interpretability and ensured consistency across modeling steps.
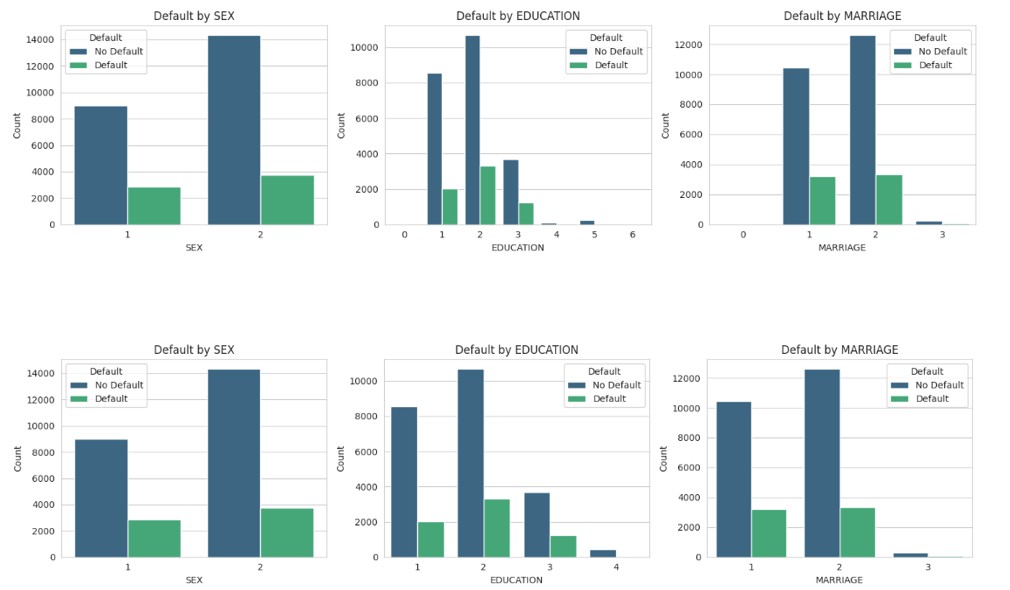
These steps significantly enhanced data quality, reducing bias and improving the models’ ability to detect rare but critical events, such as potential failures.
Model Development
Random Forest
The initial model showed overfitting. Tuning improved generalization but recall stayed low.
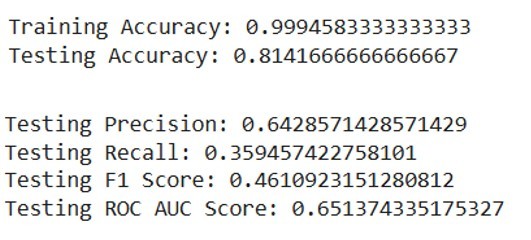

After tuning, the training accuracy has dropped compared to the initial model, which suggests reduced overfitting. The testing accuracy improved slightly, showing better generalization. Precision improved slightly, indicating fewer false positives. Recall is still relatively low, meaning the model is not capturing all actual failures. The F1 score remained similar, suggesting a continued trade-off between precision and recall. The ROC AUC remained nearly the same, indicating a similar discriminatory power. I looked for the features importance, here is the visualization :
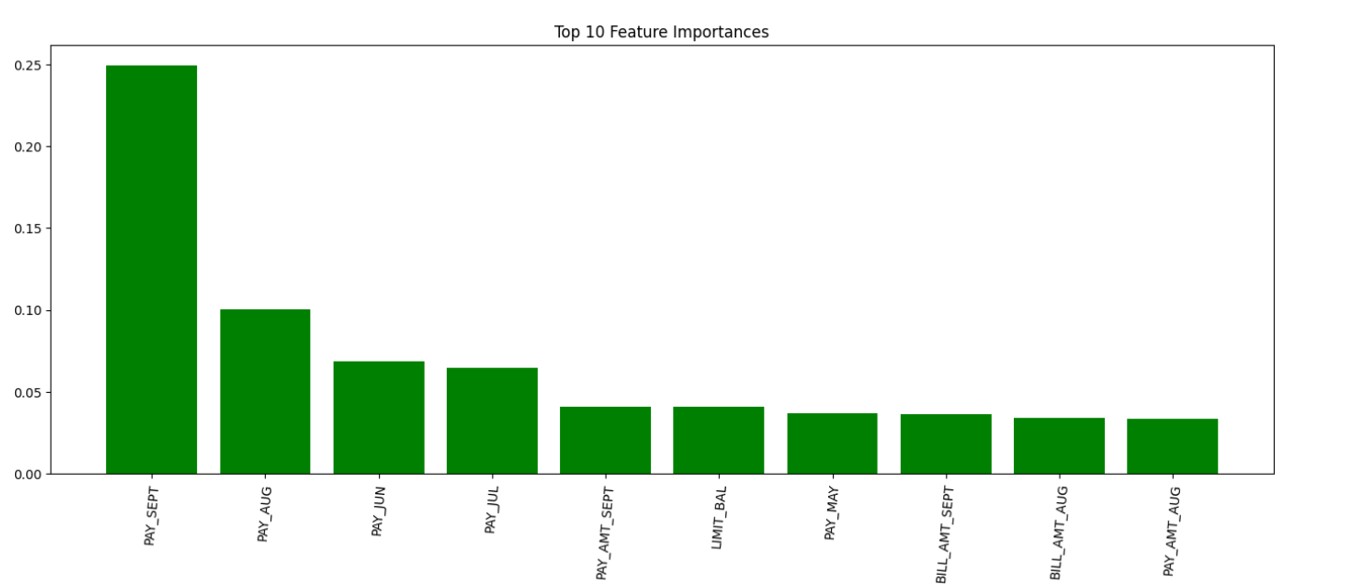
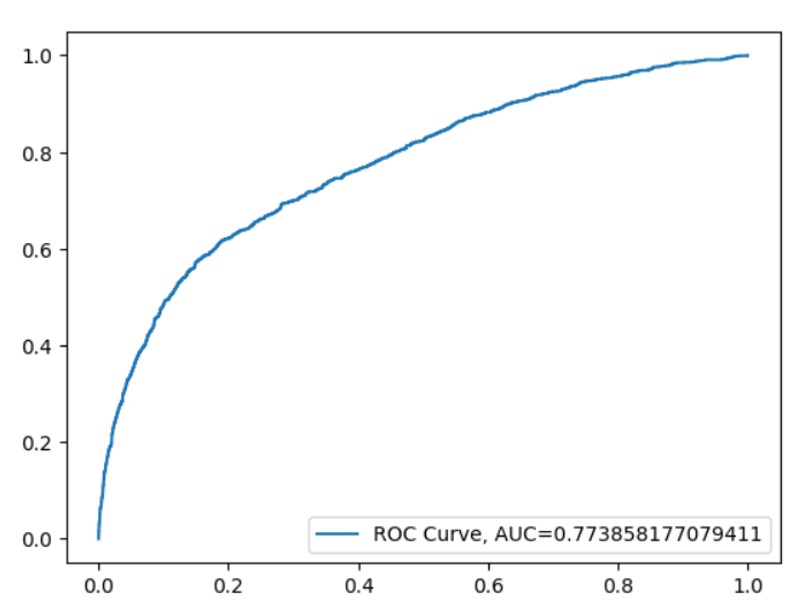
The most important feature identified is PAY_SEPT, which suggests that recent payment behavior has the highest impact on the prediction of failures. Other important features include PAY_AUG, PAY_JUN, and LIMIT_BAL, which indicate that past payment history and credit limits are key factors in predicting defaults. The AUC value of 0.7739 indicates a moderate level of performance, meaning the model is reasonably good at distinguishing between defaulting and non-defaulting customers :
Gradient Boosting
This model showed a better balance between precision and recall, with lower overfitting tendencies, suggesting improved generalization compared to Random Forest.
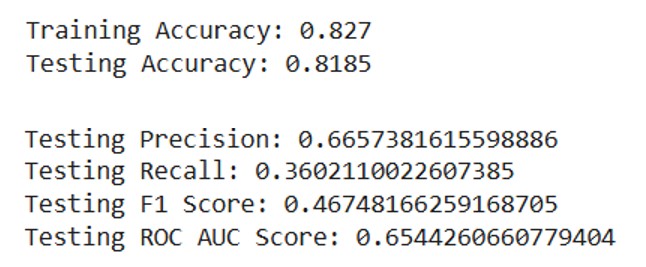
The training and testing accuracies are closer than for the Random Forest model, suggesting better generalization and reduced overfitting. However, the testing accuracy is slightly higher than that of the random forest, indicating more robustness to unseen data. Gradient Boosting shows a slightly better precision, meaning fewer false positives compared to Random Forest. The recall values are very close, meaning both models capture the same proportion of true defaults. The F1-score, which balances precision and recall, indicates a small improvement in Gradient Boosting. The ROC AUC score is marginally better in Gradient Boosting, indicating slightly better class discrimination. Again, I tuned the model with Grid Search and got the following results :

After optimization, Random Forest still shows signs of slight overfitting, while Gradient Boosting maintains a balanced performance. The testing accuracy of Gradient Boosting remains better than Random Forest, showing it is more stable and less prone to variance. Both models show improved precision after tuning, with Gradient Boosting maintaining a slight edge. Gradient Boosting has a better balance in terms of precision and recall, leading to a marginally higher F1-score. The optimized Random Forest model still struggles with recall, meaning it misses more actual defaults compared to Gradient Boosting.
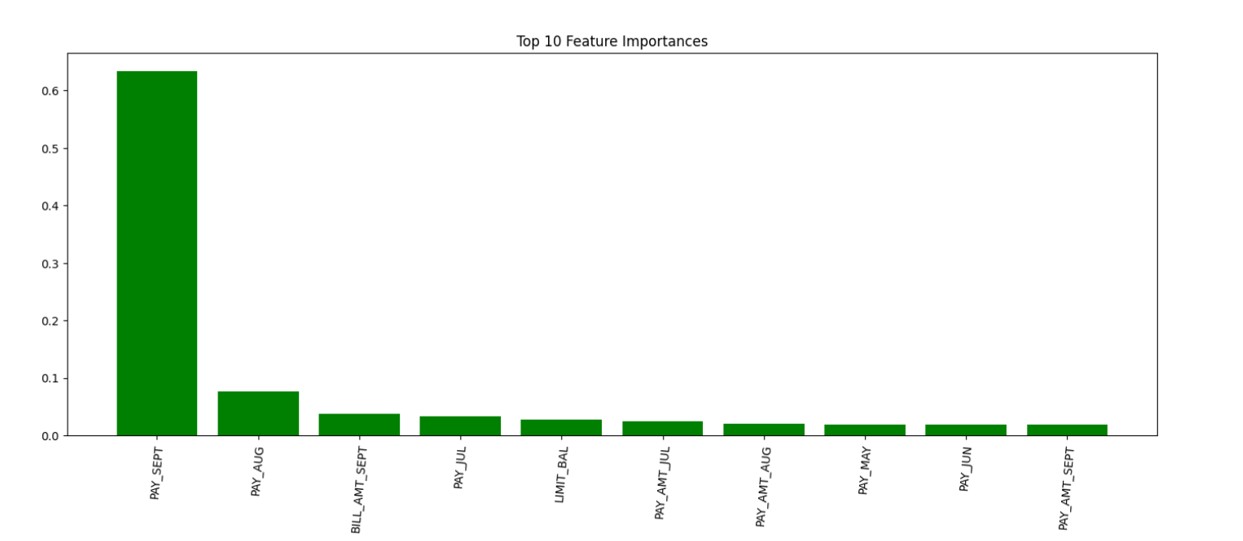
The Gradient Boosting model places a significantly higher importance on PAY_SEPT, indicating that it relies heavily on recent payment history. Other features have much lower importance, suggesting that Gradient Boosting may be focusing on fewer key variables compared to Random Forest. This indicates that Gradient Boosting might be better at identifying critical patterns while Random Forest spreads importance more evenly across features.
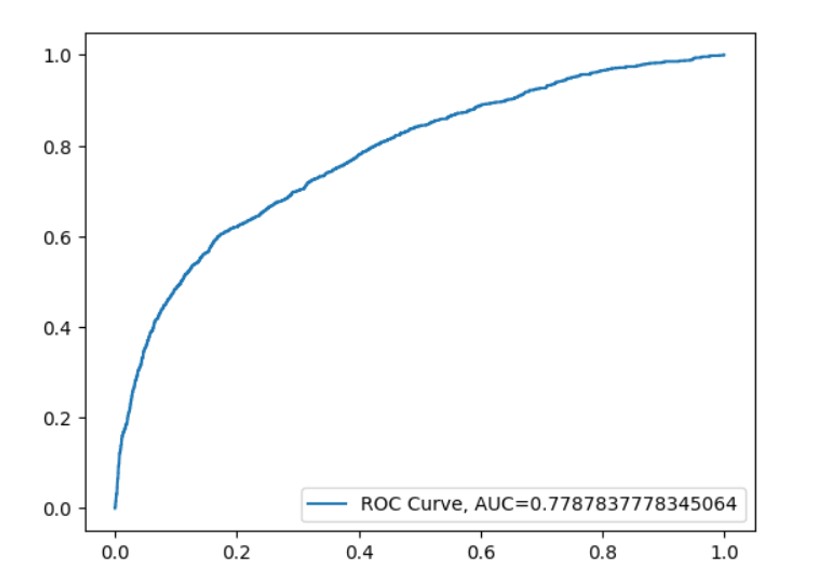
The Gradient Boosting model achieves a slightly higher AUC value, meaning it has a marginally better ability to separate defaulters from non-defaulters. Both models show a similar curve shape, but Gradient Boosting might handle threshold adjustments better due to its boosting nature.
XGBoost
It displayed slightly better precision but lower recall, indicating it was more conservative in predicting defaults.

XGBoost achieves better training accuracy than Gradient Boosting but slightly lower testing accuracy, implying a better balance than Random Forest but not as well generalized as Gradient Boosting. XGBoost has slightly lower recall and F1-score than Gradient Boosting but is still competitive. One more time I applied the Grid search and got the following tuning :

XGBoost achieves a slightly better training accuracy compared to Gradient Boosting, suggesting it learns patterns more effectively. XGBoost achieves the highest recall (0.3677), meaning it is better at identifying actual defaults compared to Random Forest and Gradient Boosting.
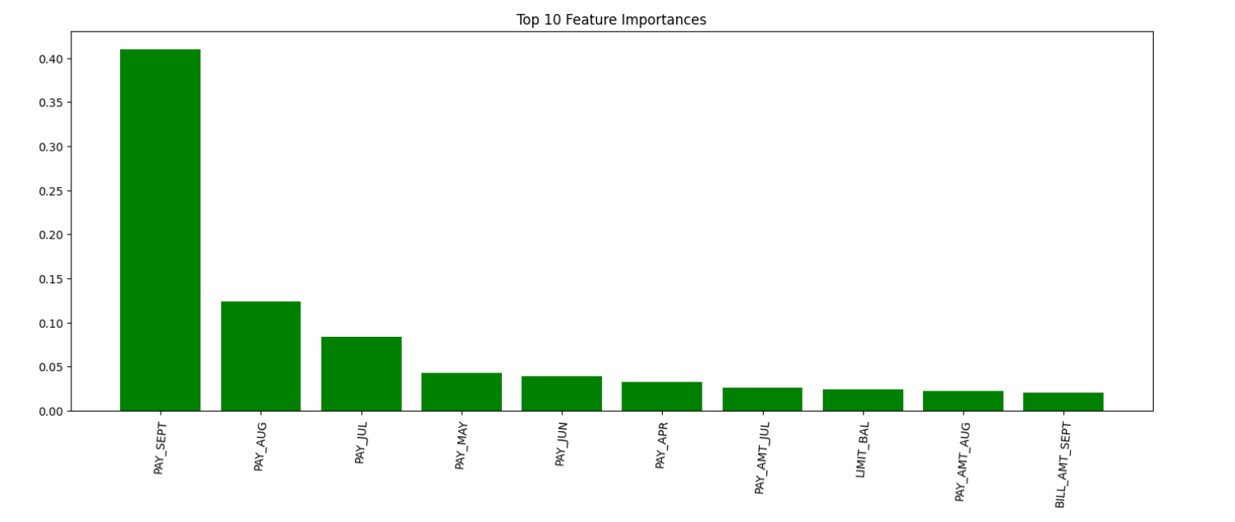
Similar to Random Forest and Gradient Boosting, the most important feature is PAY_SEPT, reinforcing the idea that recent payment behavior is crucial. However, XGBoost distributes feature importance more evenly compared to Gradient Boosting, giving slightly more importance to features like PAY_AUG and PAY_JUL. This indicates XGBoost may capture more nuanced relationships compared to the other models.
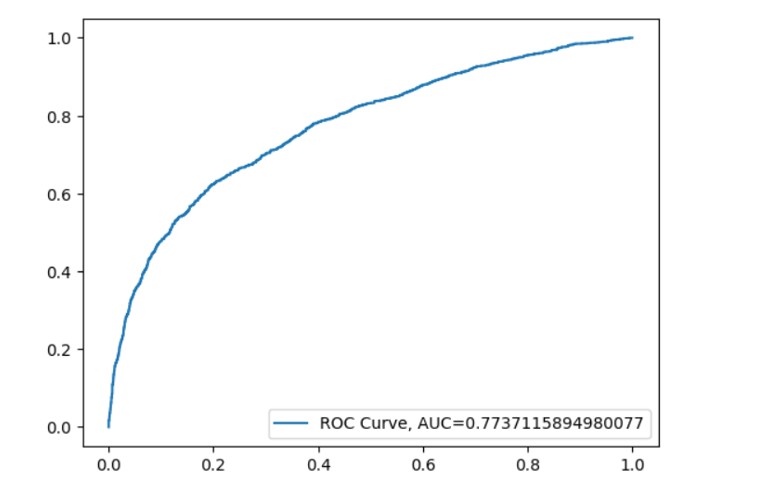
XGBoost has a comparable AUC score to Random Forest, suggesting that both models perform similarly in distinguishing classes. The ROC curve shows that while XGBoost performs well, it might not be as robust as Gradient Boosting in certain threshold ranges
Improvements from advanced techniques
SMOTE: Big recall improvement for all models.

Under-sampling: Lower precision and recall.

Cost-sensitive learning: Boosted recall but reduced precision.

Overall, the analysis suggests that handling class imbalance through SMOTE yielded the most significant improvements across all models. Random Forest exhibited the most substantial improvement in recall, making it a strong candidate for scenarios where identifying defaulters is critical. Gradient Boosting maintained a consistent balance across all evaluation metrics, proving to be the most stable model under different conditions. XGBoost, while showing strong recall, struggled with precision when cost-sensitive learning was applied. The choice of model and imbalance handling technique should be based on the specific business requirement, whether prioritizing recall to minimize financial risk or maintaining a balance to ensure reliable predictions.
Maintenance Scheduling Using Reinforcement Learning
I used Q-learning to schedule maintenance.
Accuracy: 78%
Precision: 0.51
Recall: 0.31
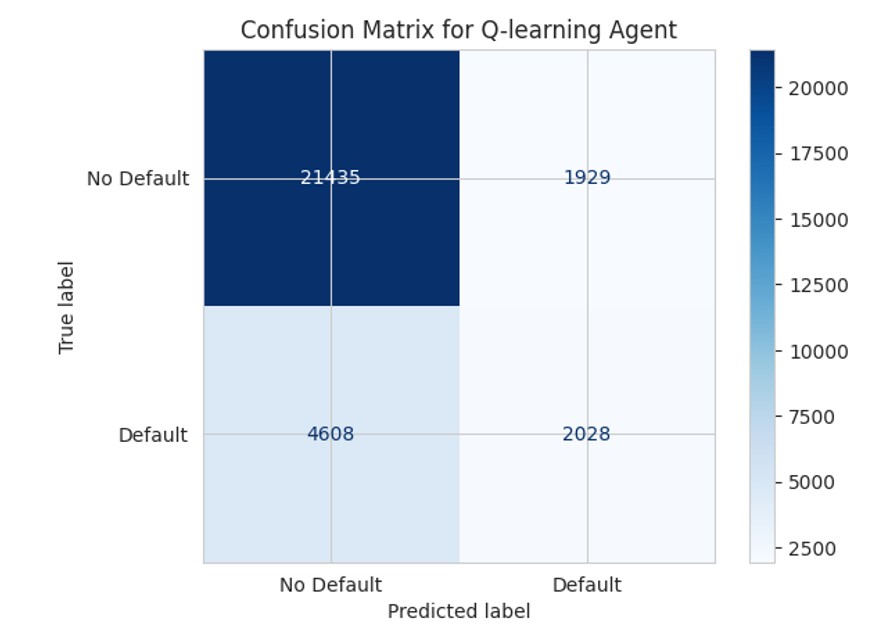
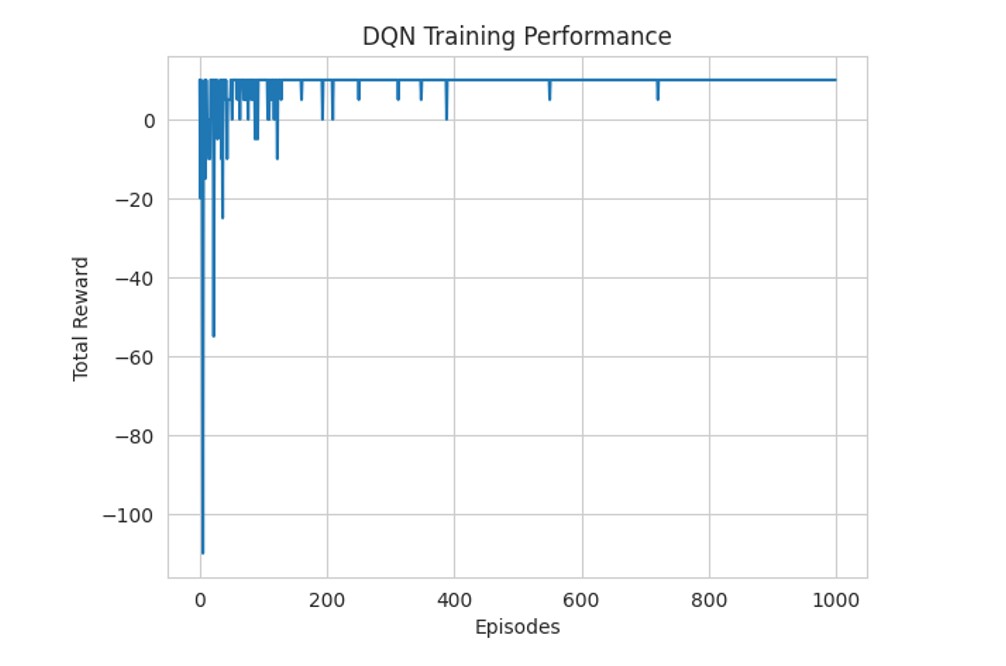
Rewards stabilized after 400 episodes. The agent prevented 2,028 failures and avoided 1/3 of potential breakdowns.
Policy evaluation: Rewards
At the start of training, the agent receives a lot of negative rewards, because of poor decision-making. It was frequently failing to prevent critical failures (which is often normal in reinforcement learning because it explores random actions). Afterward, there is an improvement trend, this is when the agent is learning from its mistakes and starts making good maintenance decisions, with some incidents on the road. Beyond episode 200, the rewards mostly stabilize around positive values, indicating that the agent has learned a stable policy, and after around 400 episodes, the rewards appear to be consistently high, implying that the agent has found an optimal policy for balancing maintenance actions and failures.
The model successfully avoided 2,028 failures, meaning it predicted maintenance actions correctly that prevented equipment breakdowns.
23364 instances of state 0 (No Default): These represent situations where no failure was present. 6636 instances of state 1 (Default): These represent situations where a failure was detected. The agent avoided approximately 1 out of 3 failures.
AutoML for Model Selection
Using TPOT, the best model was ExtraTreesClassifier (accuracy 0.82).
Key hyperparameters:
-
Bootstrap: True
-
Criterion: Entropy
-
Max Features: 0.55
-
Min Samples Leaf: 7
-
Min Samples Split: 18
-
Estimators: 100
Conclusion: Evaluation and Reporting of the Predictive Maintenance System
By combining ML, RL, and AutoML, I:
-
Improved prediction accuracy
-
Handled data imbalance effectively
-
Optimized maintenance schedules
The ExtraTreesClassifier performed best. Predictive maintenance is feasible, and future improvements could further reduce downtime and costs.
