Project Description
The LLM for Equity Trading project aimed to develop an AI-powered financial analysis platform for Crédit Mutuel Asset Management (CMAM).
The tool helps assess companies’ financial health and identify potential investment opportunities by combining:
- Structured data (financial databases)
- Unstructured data (10-K financial reports)
We integrated Llama 3.1-8B with a Retrieval-Augmented Generation (RAG) pipeline to extract and summarize insights from complex financial documents.
Key Functionalities
1. Retrieval-Augmented Generation (RAG)
RAG combines a language model with an external search system to retrieve relevant information before generating an answer.
Instead of relying only on what the AI already knows, it dynamically fetches information from a knowledge base (10-K reports) and uses it to generate accurate and context-aware responses.
This approach is particularly valuable in finance, where precision is critical. For example, RAG can extract specific details from thousands of pages of regulatory filings and provide concise, reliable answers.
Our RAG Implementation
- Chunking: Breaking reports into smaller, searchable segments.
- Indexing: Storing these chunks in a vector database.
- Retrieval: Fetching only the most relevant segments for a query.
- Response Generation: Using LLM to generate clear answers grounded in the original data.
2. Dataframe Chatbot
The DataFrame Chatbot allows users to run queries directly on structured data. The workflow is straightforward:
-
Upload a CSV file containing the dataset.
-
Select the relevant columns you want to analyze. This step is essential to reduce noise and prevent the AI from generating irrelevant or incorrect results (“hallucinations”).
-
Enter a natural language query in the chatbot.
For example, a user can type:
“Group the data by {column1} and compute the average of {column2}”
The chatbot interprets the query, executes it on the selected columns, and returns the result instantly.
🎥 Watch the demo
3. Plot Generation
The chatbot also generates dynamic financial visualizations.
The Plot Generation feature works in a very similar way to the DataFrame Chatbot, but instead of text-based answers, it creates interactive visualizations.
The workflow is:
-
Upload a CSV file with your data.
-
Select the columns you want to work with to ensure the plot is meaningful and reduce potential errors.
-
Enter a natural language query describing the plot you need.
For example:
“Make a plot of {column1} and profit for {company}”
The AI then generates an interactive visualization, making it easier for financial analysts and data professionals to explore trends and present insights
🎥 Watch the demo
Project Presentation
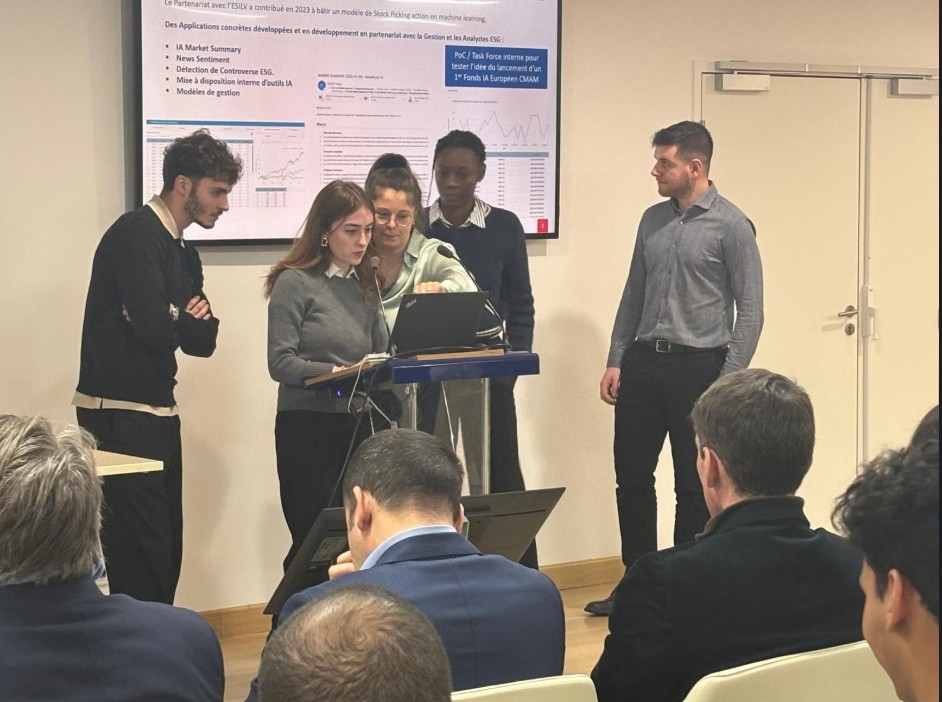
At the end of the project, we had the opportunity to present our solution to CMAM and La Française.
We demonstrated how our tool could streamline financial analysis and received positive feedback from industry professionals.

